Graphing Absolute Value Inequalities
Which of the following graphs represents the inequality below?
y < |x - 2| + 3
A
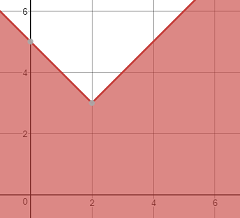 |
B
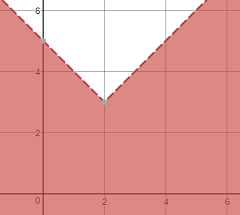 |
C
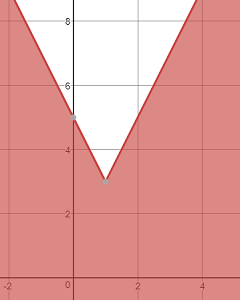 |
D
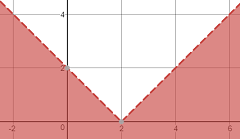 |
Question Leaderboard
Not enough data yet to show leaderboard.
 clep.ai501(c)(3) Nonprofit
Which of the following graphs represents the inequality below?
y < |x - 2| + 3
|
|
|
|
Not enough data yet to show leaderboard.