
Line Graph Interpretation
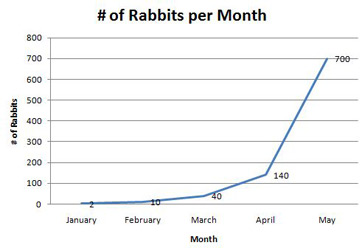
The accompanying graph displays a breeder's rabbit population over several months. During which time period did the population reach 100 rabbits?
A
After May
B
Between January and February
C
Between March and April
D
Between February and March
E
Between April and May
Question Leaderboard
Not enough data yet to show leaderboard.