
Interpreting A Demand Curve
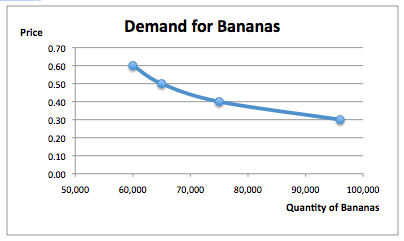
The following demand curve illustrates the relationship between the price of bananas and the quantity demanded. Based on the graph, what quantity of bananas is demanded at a price of 40 cents?
A
96,000 bananas per week
B
60,000 bananas per week
C
No bananas would be sold at this price
D
75,000 bananas per week
E
65,000 bananas per week
Question Leaderboard
Not enough data yet to show leaderboard.